Mohammed Bin Rashid Al Maktoum District 11 property prices
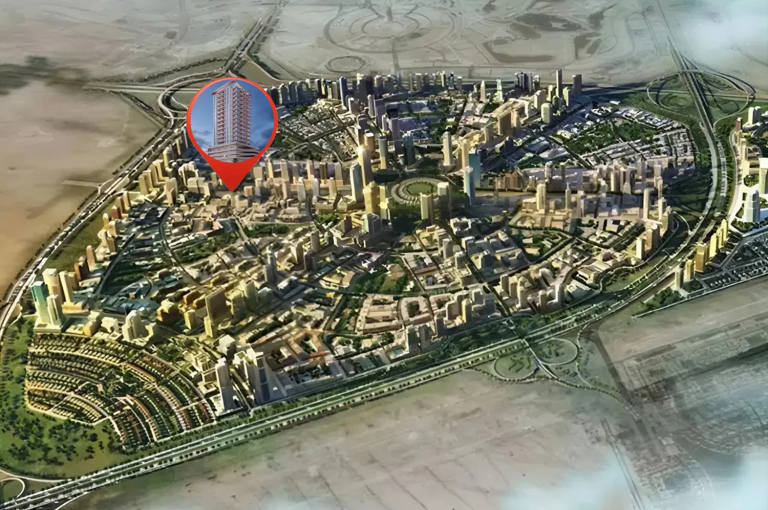
Market name: MBR City District 11Also called: District 11DLD master project: Mohammed Bin Rashid AL Maktoum District 11DLD area: Wadi Al Safa 3
What properties in Mohammed Bin Rashid Al Maktoum District 11 actually sold for over the last 12 months — real recorded transactions, not asking prices.
Data to 2 November 2026 · 12-month window · residential sales onlyVillas and townhouses with 4 or more bedrooms: median rent AED 170,000 a year, gross yield 4.4%In short
In the 12 months to 2 November 2026, apartments in MBR City District 11 sold for a median AED 1,824 per sq ft (265 sales), villas and townhouses for AED 2,035 per sq ft (297 sales) and plots for AED 1,418 per sq ft (52 sales). Like for like, apartment prices per sq ft were down 1.2% compared with the 12 months before.
Source: Dubai Land Department open data, published on data.dubai and used under the Dubai Open Data Licence. The figures are Throne Properties’ own analysis and are indicative only. They are not endorsed by the Dubai Land Department or the Government of Dubai. How we calculate
Get the full price report on WhatsAppPrice per sqft by quarter
Median AED per sqft of the off-plan homes sold in each quarter, about three months per bar. The bars move with which buildings sold, so they are not a like-for-like trend.
Typical price range
Middle half of all sales.
| Price per sqft (25th–75th percentile) | AED 1,552 – 1,913 |
| Sale price (middle 80% of sales) | AED 954,783 – AED 2.41M |
| Ready properties (per sqft) | AED 1,386 (8 sales) |
| Off-plan (per sqft) | AED 1,827 (257 sales) |
By number of bedrooms
Only bedroom counts with enough sales to be meaningful are shown.
| Bedrooms | Sales | Median AED / sqft | Median price |
|---|---|---|---|
| 1 bed | 150 | 1,865 | AED 1.38M |
| 2 bed | 113 | 1,699 | AED 2.01M |
Most active buildings and projects
Where most of the apartment sales happened.
| Building / project | Sales | Median AED / sqft |
|---|---|---|
| Art House Private Residences By Viva | 42 | 1,958 |
| Rome 3 By Sd - B | 40 | 782 |
| Rome 3 By Sd - A | 25 | 1,935 |
| Gate Eleven Residences -c | 19 | 1,836 |
| The Willows Residences | 18 | 1,880 |
Price per sqft by quarter
Median AED per sqft of the off-plan homes sold in each quarter, about three months per bar. The bars move with which buildings sold, so they are not a like-for-like trend.
Typical price range
Middle half of all sales.
| Price per sqft (25th–75th percentile) | AED 1,613 – 2,995 |
| Sale price (middle 80% of sales) | AED 3.4M – AED 19.01M |
| Ready properties (per sqft) | AED 1,613 (139 sales) |
| Off-plan (per sqft) | AED 2,964 (158 sales) |
By number of bedrooms
Only bedroom counts with enough sales to be meaningful are shown.
| Bedrooms | Sales | Median AED / sqft | Median price |
|---|---|---|---|
| 3 bed | 29 | 2,741 | AED 6.34M |
| 4 bed | 183 | 1,755 | AED 4.29M |
| 5 bed | 85 | 2,951 | AED 14.11M |
Most active buildings and projects
Where most of the villa or townhouse sales happened.
| Building / project | Sales | Median AED / sqft |
|---|---|---|
| The Fields At D11 - Mbrmc | 136 | 1,613 |
| Knightsbridge Park | 32 | 3,120 |
| Numa Reserve | 26 | 2,817 |
| The Watercrest By Ellington | 23 | 3,048 |
| Knightsbridge Park 2 | 18 | 2,960 |
Price per sqft by quarter
Median AED per sqft of the plots sold in each quarter, about three months per bar. The bars move with which projects sold, so they are not a like-for-like trend.
Typical price range
Middle half of all sales.
| Price per sqft (25th–75th percentile) | AED 1,334 – 1,500 |
| Sale price (middle 80% of sales) | AED 6.02M – AED 27.76M |
| Ready properties (per sqft) | AED 1,418 (52 sales) |
| Off-plan (per sqft) | — |
Most active buildings and projects
Where most of the plot sales happened.
| Building / project | Sales | Median AED / sqft |
|---|---|---|
| Mohammed Bin Rashid Al Maktoum City, District 11- Opal Gardens | 44 | 1,410 |
Projects in Mohammed Bin Rashid Al Maktoum District 11
Newest launches first.
Rents and yields in Mohammed Bin Rashid Al Maktoum District 11
In the 12 months to 2 November 2026, villas and townhouses with 4 or more bedrooms in Mohammed Bin Rashid Al Maktoum District 11 were let on new 12-month leases for a median AED 170,000 a year (228 leases). Set against the median price of ready villas and townhouses with 4 or more bedrooms sold in the same months (AED 3.86M), that is a gross yield of 4.4%.
See how Mohammed Bin Rashid Al Maktoum District 11 compares with other areas: Dubai rental yields by area
Villas and townhouses
Median yearly rent of new 12-month leases, and the gross yield against ready homes sold in the same 12 months.
| Bedrooms | New leases | Median rent a year | Middle half of rents | Gross yield |
|---|---|---|---|---|
| 3 bed | 30 | AED 150,000 | AED 141,000 – 160,000 | Ask us |
| 4+ bed | 228 | AED 170,000 | AED 158,000 – 190,000 | 4.4%median price AED 3.86M (126 sales) |
Rents by building
One bedroom type per building: the most let type that has a gross yield, otherwise the most let type. Open a building for every bedroom type. Building yields rest on fewer sales than area figures, so yields less than about 1 point apart are within the margin of error.
| Building | Type shown | Median rent a year | Gross yield |
|---|---|---|---|
| The Fields At D11 - Mbrmc4+ bed villa | 4+ bed villa | AED 170,000 | 4.4%likely 4.2–4.6% |
New 12-month leases from 3 November 2025 to 2 November 2026; renewals are left out. Gross yield is the median yearly rent divided by the median price of ready homes of the same type and bedrooms sold in the same 12 months, before service charges, fees, maintenance and empty months. Each rent figure rests on at least 20 new leases and each yield also on at least 20 sales of ready homes.
Source: Dubai Land Department rent contracts (Ejari) and sales transactions, open data published on data.dubai and used under the Dubai Open Data Licence. The figures are Throne Properties’ own analysis and are indicative only. They are not endorsed by the Dubai Land Department or the Government of Dubai. How we calculate rents and yields
Get the full rent and sales report for Mohammed Bin Rashid Al Maktoum District 11 on WhatsApp
Every new lease and ready-home sale behind these figures, by bedrooms and size, with the gross yield for the home you have in mind.
- Investors: rent, price and gross yield side by side
- Tenants: what similar homes let for on new leases
- Owners: a rental estimate for your home
Building prices in Mohammed Bin Rashid Al Maktoum District 11
| Building / project | Sales (24 mo) | Median AED / sqft | vs a year ago |
|---|---|---|---|
| The Fields At D11 - Mbrmc | 299 | 1,613 | ▲ +0.5% |
| Mohammed Bin Rashid Al Maktoum City, District 11- Opal Gardens | 137 | 1,413 | ▲ +7.3% |
| The Watercrest by Ellington | 79 | 3,048 | ▲ +2.0% |
| Woodland Terraces | 50 | 1,868 | ▼ -3.6% |
| Knightsbridge Park | 50 | 3,120 | ▲ +8.5% |
| High Best Tower - Building A | 43 | 1,605 | ▲ +4.4% |
| Art House Private Residences by Viva | 42 | 1,958 | — |
| Rome 2 by Sd | 40 | 1,626 | — |
| Rome 3 by Sd - B | 40 | 782 | — |
| Gate Eleven Residences -A | 39 | 1,822 | ▲ +0.9% |
| Gate Eleven Residences -B | 38 | 1,805 | ▼ -0.8% |
| High Best Tower - Building B | 37 | 1,465 | — |
| Gate Eleven Residences -C | 37 | 1,836 | ▲ +2.6% |
| Rome by Sd | 33 | 1,647 | ▼ -14.6% |
| Gate Eleven Residences -D | 33 | 1,822 | ▲ +3.4% |
| Karl Lagerfeld Villas by Taraf | 29 | 3,030 | ▲ +23.9% |
| Numa Reserve | 27 | 2,817 | — |
| The Spark by Esnaad | 25 | 1,658 | — |
| Rome 3 by Sd - A | 25 | 1,935 | — |
| Knightsbridge Park 2 | 21 | 2,960 | — |
Selling or buying in Mohammed Bin Rashid Al Maktoum District 11?
Get a free valuation based on real transactions in your building, or tell us what you need and we will match you with listings.
Frequently asked questions
What is the average price per sqft for apartments in Mohammed Bin Rashid Al Maktoum District 11?
Based on 265 Dubai Land Department sales in the 12 months to 2 November 2026, the median price for a apartment in Mohammed Bin Rashid Al Maktoum District 11 is AED 1,824 per sqft, with a median sale price of AED 1.52M.
What is the average price per sqft for villa or townhouses in Mohammed Bin Rashid Al Maktoum District 11?
Based on 297 Dubai Land Department sales in the 12 months to 2 November 2026, the median price for a villa or townhouse in Mohammed Bin Rashid Al Maktoum District 11 is AED 2,035 per sqft, with a median sale price of AED 6.66M.
What is the average price per sqft for plots in Mohammed Bin Rashid Al Maktoum District 11?
Based on 52 Dubai Land Department sales in the 12 months to 2 November 2026, the median price for a plot in Mohammed Bin Rashid Al Maktoum District 11 is AED 1,418 per sqft, with a median sale price of AED 9.43M.
Are property prices in MBR City District 11 going up or down?
Comparing the 12 months to 2 November 2026 with the 12 months before, like for like (the same buildings, bedrooms and ready or off-plan status), apartment prices per sq ft in MBR City District 11 were down 1.2%, based on 104 sales in 9 buildings that sold in both periods.
What is MBR City District 11 called in Dubai Land Department records?
Dubai Land Department records list MBR City District 11 under the master project Mohammed Bin Rashid AL Maktoum District 11, in the area Wadi Al Safa 3. It is also called District 11.
How much does a 1-bedroom apartment cost in MBR City District 11?
The median price of a 1-bedroom apartment in MBR City District 11 was AED 1.38M (150 sales in the 12 months to 2 November 2026, AED 1,865 per sq ft). Other sizes: 2-bedroom AED 2.01M.
Other Dubai areas
All areas →Figures are medians of Dubai Land Department recorded residential sales over the 12 months to 2 November 2026 and are indicative only. Dubai Land Department publishes with a delay, so the most recent weeks may be incomplete. Villa, townhouse and plot prices per sqft use the registered unit or plot area, so they are not directly comparable with apartment prices. Individual properties vary with size, view, floor, condition and payment terms. This is not a valuation or financial advice.