Jumeirah Village Triangle property prices
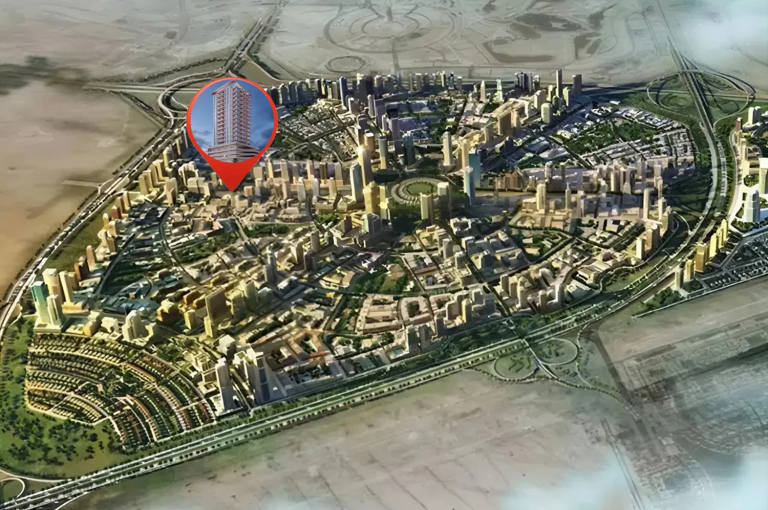
Market name: Jumeirah Village TriangleAlso called: JVTDLD area: Al Barsha South Fifth
What properties in Jumeirah Village Triangle actually sold for over the last 12 months — real recorded transactions, not asking prices.
Data to 2 November 2026 · 12-month window · residential sales only1-bedroom apartments: median rent AED 73,000 a year, gross yield 7.5%In short
In the 12 months to 2 November 2026, apartments in Jumeirah Village Triangle sold for a median AED 1,654 per sq ft (3,584 sales, median price AED 1.14M) and villas and townhouses for AED 1,059 per sq ft (104 sales, median price AED 5M). Like for like (same buildings, bedrooms and ready or off-plan status), apartment prices per sq ft were up 1.5% compared with the 12 months before.
Source: Dubai Land Department open data, published on data.dubai and used under the Dubai Open Data Licence. The figures are Throne Properties’ own analysis and are indicative only. They are not endorsed by the Dubai Land Department or the Government of Dubai. How we calculate
Get the full price report on WhatsAppPrice per sqft by quarter
Median AED per sqft of the off-plan homes sold in each quarter, about three months per bar. The bars move with which buildings sold, so they are not a like-for-like trend.
Typical price range
Middle half of all sales.
| Price per sqft (25th–75th percentile) | AED 1,470 – 1,853 |
| Sale price (middle 80% of sales) | AED 675,156 – AED 1.68M |
| Ready properties (per sqft) | AED 1,341 (457 sales) |
| Off-plan (per sqft) | AED 1,690 (3,127 sales) |
By number of bedrooms
Only bedroom counts with enough sales to be meaningful are shown.
| Bedrooms | Sales | Median AED / sqft | Median price |
|---|---|---|---|
| Studio | 1,186 | 1,918 | AED 775,082 |
| 1 bed | 1,805 | 1,615 | AED 1.22M |
| 2 bed | 529 | 1,417 | AED 1.72M |
| 3 bed | 59 | 1,435 | AED 2.77M |
| 4 bed | 5 | 1,293 | AED 3.7M |
Most active buildings and projects
Where most of the apartment sales happened.
| Building / project | Sales | Median AED / sqft |
|---|---|---|
| Binghatti Flare 02 | 363 | 1,729 |
| Binghatti Flare 01 | 331 | 1,630 |
| Sol Levante | 312 | 1,753 |
| Voxa Residences | 261 | 1,949 |
| Interstellar Tower | 242 | 1,712 |
Price per sqft by quarter
Median AED per sqft of the ready homes sold in each quarter, about three months per bar. The bars move with which buildings sold, so they are not a like-for-like trend.
Typical price range
Middle half of all sales.
| Price per sqft (25th–75th percentile) | AED 768 – 1,414 |
| Sale price (middle 80% of sales) | AED 2.85M – AED 7.54M |
| Ready properties (per sqft) | AED 1,059 (104 sales) |
| Off-plan (per sqft) | — |
By number of bedrooms
Only bedroom counts with enough sales to be meaningful are shown.
| Bedrooms | Sales | Median AED / sqft | Median price |
|---|---|---|---|
| 3 bed | 5 | 1,826 | AED 3.4M |
| 4 bed | 7 | 2,018 | AED 4M |
Projects in Jumeirah Village Triangle
Newest launches first.
Homes for sale and rent in Jumeirah Village Triangle
Rents and yields in Jumeirah Village Triangle
In the 12 months to 2 November 2026, 1-bedroom apartments in Jumeirah Village Triangle were let on new 12-month leases for a median AED 73,000 a year (749 leases). Set against the median price of ready 1-bedroom apartments sold in the same months (AED 975,000), that is a gross yield of 7.5%. Across 1 and 2-bedroom apartments, the gross yield is about 7.2%.
See how Jumeirah Village Triangle compares with other areas: Dubai rental yields by area
Apartments
Median yearly rent of new 12-month leases, and the gross yield against ready homes sold in the same 12 months.
| Bedrooms | New leases | Median rent a year | Middle half of rents | Gross yield |
|---|---|---|---|---|
| Studio | 622 | AED 48,000 | AED 43,000 – 52,500 | Ask us |
| 1 bed | 749 | AED 73,000 | AED 65,000 – 80,000 | 7.5%median price AED 975,000 (205 sales) |
| 2 bed | 200 | AED 100,000 | AED 83,000 – 115,000 | 6.3%median price AED 1.6M (91 sales) |
| 3 bed | 30 | AED 170,000 | AED 142,500 – 180,000 | Ask us |
Villas and townhouses
Median yearly rent of new 12-month leases.
| Bedrooms | New leases | Median rent a year | Middle half of rents |
|---|---|---|---|
| 1 bed | 79 | AED 130,000 | AED 120,000 – 139,000 |
| 2 bed | 122 | AED 195,000 | AED 175,000 – 229,000 |
Rents by building
One bedroom type per building: the most let type that has a gross yield, otherwise the most let type. Open a building for every bedroom type. Building yields rest on fewer sales than area figures, so yields less than about 1 point apart are within the margin of error.
| Building | Type shown | Median rent a year | Gross yield |
|---|---|---|---|
| Al Jawhara TowerStudio | Studio | AED 44,000 | 8.6%likely 8.2–9.1% |
| Terhab Hotel & Towers - Tower 11 bed | 1 bed | AED 73,000 | 4.8%likely 4.3–5.5% |
| Forum Heights1 bed | 1 bed | AED 75,000 | See building |
| Emerald Vision Tower1 bed | 1 bed | AED 78,000 | See building |
| The Ivy1 bed | 1 bed | AED 85,000 | See building |
| Seslia TowerStudio | Studio | AED 48,000 | 9.1%likely 8.3–9.9% |
| Bali Residences1 bed | 1 bed | AED 76,500 | See building |
| Plazzo ResidenceStudio | Studio | AED 45,000 | See building |
| Al Manara Tower1 bed | 1 bed | AED 58,000 | See building |
| Milestone Residences1 bed | 1 bed | AED 88,000 | 7.5%likely 6.9–8.2% |
| 555 Park Views1 bed | 1 bed | AED 87,000 | See building |
| Green Park1 bed | 1 bed | AED 60,000 | See building |
New 12-month leases from 3 November 2025 to 2 November 2026; renewals are left out. Gross yield is the median yearly rent divided by the median price of ready homes of the same type and bedrooms sold in the same 12 months, before service charges, fees, maintenance and empty months. Each rent figure rests on at least 20 new leases and each yield also on at least 20 sales of ready homes.
Source: Dubai Land Department rent contracts (Ejari) and sales transactions, open data published on data.dubai and used under the Dubai Open Data Licence. The figures are Throne Properties’ own analysis and are indicative only. They are not endorsed by the Dubai Land Department or the Government of Dubai. How we calculate rents and yields
Get the full rent and sales report for Jumeirah Village Triangle on WhatsApp
Every new lease and ready-home sale behind these figures, by bedrooms and size, with the gross yield for the home you have in mind.
- Investors: rent, price and gross yield side by side
- Tenants: what similar homes let for on new leases
- Owners: a rental estimate for your home
Building prices in Jumeirah Village Triangle
Selling or buying in Jumeirah Village Triangle?
Get a free valuation based on real transactions in your building, or tell us what you need and we will match you with listings.
Frequently asked questions
What is the average price per sqft for apartments in Jumeirah Village Triangle?
Based on 3,584 Dubai Land Department sales in the 12 months to 2 November 2026, the median price for a apartment in Jumeirah Village Triangle is AED 1,654 per sqft, with a median sale price of AED 1.14M.
What is the average price per sqft for villa or townhouses in Jumeirah Village Triangle?
Based on 104 Dubai Land Department sales in the 12 months to 2 November 2026, the median price for a villa or townhouse in Jumeirah Village Triangle is AED 1,059 per sqft, with a median sale price of AED 5M.
Are property prices in Jumeirah Village Triangle going up or down?
Comparing the 12 months to 2 November 2026 with the 12 months before, like for like (the same buildings, bedrooms and ready or off-plan status), apartment prices per sq ft in Jumeirah Village Triangle were up 1.5%, based on 2,387 sales in 51 buildings that sold in both periods.
What is Jumeirah Village Triangle called in Dubai Land Department records?
Dubai Land Department records list Jumeirah Village Triangle as a master project in the area Al Barsha South Fifth. It is also called JVT.
What do ready and off-plan apartments cost in Jumeirah Village Triangle?
In the 12 months to 2 November 2026, ready apartments in Jumeirah Village Triangle sold for a median AED 1,341 per sq ft (457 sales) and off-plan apartments for AED 1,690 per sq ft (3,127 sales). They are mostly different buildings, so the gap is not a like-for-like comparison.
How much does a 1-bedroom apartment cost in Jumeirah Village Triangle?
The median price of a 1-bedroom apartment in Jumeirah Village Triangle was AED 1.22M (1,805 sales in the 12 months to 2 November 2026, AED 1,615 per sq ft). Other sizes: studio AED 775,082, 2-bedroom AED 1.72M and 3-bedroom AED 2.77M.
Other Dubai areas
All areas →Figures are medians of Dubai Land Department recorded residential sales over the 12 months to 2 November 2026 and are indicative only. Dubai Land Department publishes with a delay, so the most recent weeks may be incomplete. Villa, townhouse and plot prices per sqft use the registered unit or plot area, so they are not directly comparable with apartment prices. Individual properties vary with size, view, floor, condition and payment terms. This is not a valuation or financial advice.