International Media Production Zone property prices
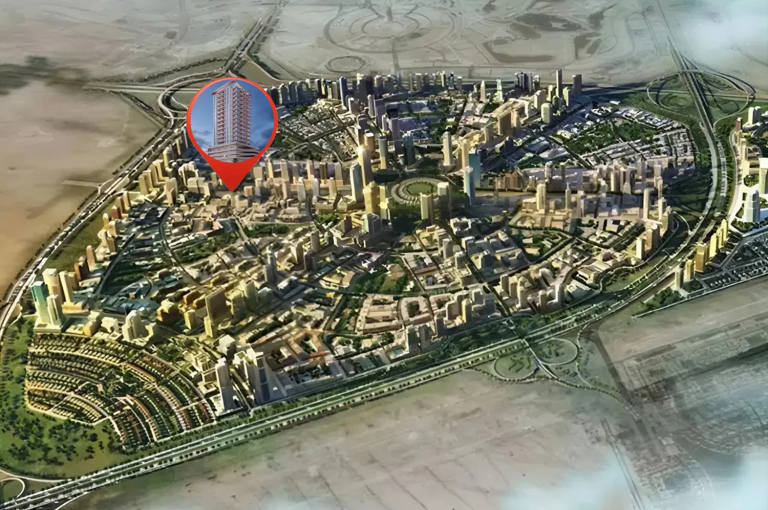
Market name: Dubai Production City (IMPZ)DLD master project: International Media Production ZoneDLD area: Me'Aisem First
What properties in International Media Production Zone actually sold for over the last 12 months — real recorded transactions, not asking prices.
Data to 2 November 2026 · 12-month window · residential sales onlyStudios: median rent AED 40,000 a year, gross yield 9.5%In short
In the 12 months to 2 November 2026, apartments in Dubai Production City (IMPZ) sold for a median AED 1,341 per sq ft across 3,049 sales, at a median price of AED 938,000. Like for like (same buildings, bedrooms and ready or off-plan status), prices per sq ft were up 3.5% compared with the 12 months before.
Source: Dubai Land Department open data, published on data.dubai and used under the Dubai Open Data Licence. The figures are Throne Properties’ own analysis and are indicative only. They are not endorsed by the Dubai Land Department or the Government of Dubai. How we calculate
Get the full price report on WhatsAppPrice per sqft by quarter
Median AED per sqft of the off-plan homes sold in each quarter, about three months per bar. The bars move with which buildings sold, so they are not a like-for-like trend.
Typical price range
Middle half of all sales.
| Price per sqft (25th–75th percentile) | AED 1,151 – 1,499 |
| Sale price (middle 80% of sales) | AED 499,813 – AED 1.59M |
| Ready properties (per sqft) | AED 992 (791 sales) |
| Off-plan (per sqft) | AED 1,406 (2,258 sales) |
By number of bedrooms
Only bedroom counts with enough sales to be meaningful are shown.
| Bedrooms | Sales | Median AED / sqft | Median price |
|---|---|---|---|
| Studio | 1,144 | 1,526 | AED 653,330 |
| 1 bed | 1,298 | 1,308 | AED 1.07M |
| 2 bed | 516 | 1,254 | AED 1.56M |
| 3 bed | 91 | 1,164 | AED 2.1M |
Most active buildings and projects
Where most of the apartment sales happened.
| Building / project | Sales | Median AED / sqft |
|---|---|---|
| Vista By Vision | 309 | 1,248 |
| Reef 996 | 244 | 1,646 |
| Samana Sky Views | 196 | 1,508 |
| Ivy At Park Five | 187 | 1,457 |
| Binghatti Elite | 145 | 1,533 |
Projects in International Media Production Zone
Newest launches first.
- Reef 996
- Vista by Vision
- Sera Gardens by Vision
- Eira Residence
- Lawncrest
- Dania
- New Project by Kusto Homes X AYS Developers
- Nirvana Residences 1
Homes for sale and rent in International Media Production Zone
Rents and yields in International Media Production Zone
In the 12 months to 2 November 2026, studios in International Media Production Zone were let on new 12-month leases for a median AED 40,000 a year (1,425 leases). Set against the median price of ready studios sold in the same months (AED 420,000), that is a gross yield of 9.5%.
See how International Media Production Zone compares with other areas: Dubai rental yields by area
Apartments
Median yearly rent of new 12-month leases, and the gross yield against ready homes sold in the same 12 months.
Rents by building
One bedroom type per building: the most let type that has a gross yield, otherwise the most let type. Open a building for every bedroom type. Building yields rest on fewer sales than area figures, so yields less than about 1 point apart are within the margin of error.
| Building | Type shown | Median rent a year | Gross yield |
|---|---|---|---|
| Jannat1 bed | 1 bed | AED 72,000 | 7.2%likely 6.9–7.5% |
| Oakwood Residency1 bed | 1 bed | AED 56,500 | 8.9%likely 8.2–9.5% |
| Viera Residences1 bed | 1 bed | AED 70,000 | 6.0%likely 5.4–6.7% |
| Myka ResidenceStudio | Studio | AED 49,000 | See building |
New 12-month leases from 3 November 2025 to 2 November 2026; renewals are left out. Gross yield is the median yearly rent divided by the median price of ready homes of the same type and bedrooms sold in the same 12 months, before service charges, fees, maintenance and empty months. Each rent figure rests on at least 20 new leases and each yield also on at least 20 sales of ready homes.
Source: Dubai Land Department rent contracts (Ejari) and sales transactions, open data published on data.dubai and used under the Dubai Open Data Licence. The figures are Throne Properties’ own analysis and are indicative only. They are not endorsed by the Dubai Land Department or the Government of Dubai. How we calculate rents and yields
Get the full rent and sales report for International Media Production Zone on WhatsApp
Every new lease and ready-home sale behind these figures, by bedrooms and size, with the gross yield for the home you have in mind.
- Investors: rent, price and gross yield side by side
- Tenants: what similar homes let for on new leases
- Owners: a rental estimate for your home
Building prices in International Media Production Zone
| Building / project | Sales (24 mo) | Median AED / sqft | vs a year ago |
|---|---|---|---|
| Binghatti Elite | 1,793 | 1,533 | ▲ +13.8% |
| Samana Sky Views | 546 | 1,508 | ▼ -0.4% |
| Samana Resorts - Tower A | 495 | 1,279 | ▲ +0.9% |
| Samana Resorts - Tower B | 464 | 1,348 | ▲ +0.2% |
| Elm At Park Five - A | 310 | 1,355 | ▲ +0.7% |
| Vista by Vision | 309 | 1,248 | — |
| Reef 996 | 244 | 1,646 | — |
| Elm At Park Five - B | 219 | 1,322 | ▼ -1.0% |
| Samana Lake Views 2 | 197 | 1,467 | ▲ +2.2% |
| Ember At Park Five | 197 | 1,339 | ▼ -0.8% |
| Ivy At Park Five | 187 | 1,457 | — |
| Jannat | 184 | 1,367 | ▲ +6.7% |
| Soul by vision | 176 | 1,164 | ▲ +3.4% |
| Viera Residences | 144 | 1,389 | ▲ +3.7% |
| Sera Gardens by Vision | 141 | 1,513 | — |
| Neem at Park Five | 131 | 1,332 | ▲ +3.8% |
| Ikarus Tower | 130 | 895 | ▲ +12.2% |
| Lakeside C | 127 | 1,021 | ▲ +6.1% |
| Lakeside B | 119 | 1,054 | ▲ +9.6% |
| Samana Lake Views | 110 | 1,277 | ▲ +1.7% |
| Lakeside D | 101 | 1,047 | ▲ +7.9% |
| Lakeside A | 93 | 1,042 | ▲ +4.6% |
| Qasr Sabah I | 91 | 726 | — |
| Golf Terrace Residences by Asak | 91 | 1,433 | — |
| Golf Grove by Regent | 89 | 1,360 | ▼ -0.8% |
| Mesk 2 | 72 | 1,247 | ▲ +0.2% |
| Alder At Park Five | 69 | 1,378 | — |
| The Crescent A | 65 | 862 | ▲ +10.9% |
| Lago Vista-C | 65 | 806 | ▲ +5.1% |
| The Crescent B | 65 | 834 | ▲ +3.8% |
| Lago Vista-B | 63 | 737 | ▲ +2.8% |
| Lago Vista-A | 60 | 857 | ▲ +7.0% |
| The Crescent C | 57 | 812 | ▲ +6.4% |
| Noor 3 | 51 | 1,382 | ▲ +3.6% |
| Oakwood Residency | 51 | 788 | ▲ +11.0% |
| Afnan 4 | 49 | 1,213 | ▲ +2.4% |
| Eira | 46 | 1,612 | — |
| Dania 2 | 44 | 1,259 | ▲ +4.6% |
| Centrium Tower 1 | 42 | 846 | ▲ +8.7% |
| Noor 5 | 41 | 1,169 | — |
| Samana Portofino | 41 | 1,644 | ▲ +7.3% |
| Dania 3 | 38 | 1,271 | ▲ +0.8% |
| Centrium Tower 4 | 35 | 875 | ▲ +9.5% |
| Mesk 1 | 34 | 1,335 | ▲ +4.1% |
| Alwan Residence 1 | 34 | 1,145 | ▲ +6.9% |
| Dania 4 | 31 | 1,275 | ▲ +13.0% |
| Myka Residence | 31 | 1,255 | ▲ +3.8% |
| Afnan 1 | 31 | 1,218 | ▲ +5.7% |
| Afnan 5 | 28 | 1,242 | ▲ +3.5% |
| Lawncrest by Zimaya | 27 | 1,491 | — |
| Centrium Tower 2 | 25 | 821 | ▲ +4.9% |
| Afnan 2 | 23 | 1,171 | ▲ +9.3% |
| Noor 2 | 22 | 1,332 | ▲ +4.1% |
| Noor 4 | 22 | 1,281 | — |
| Nirvana Residences - I | 21 | 1,650 | — |
| Qasr Sabah 2 | 20 | 709 | — |
Selling or buying in International Media Production Zone?
Get a free valuation based on real transactions in your building, or tell us what you need and we will match you with listings.
Frequently asked questions
What is the average price per sqft for apartments in International Media Production Zone?
Based on 3,049 Dubai Land Department sales in the 12 months to 2 November 2026, the median price for a apartment in International Media Production Zone is AED 1,341 per sqft, with a median sale price of AED 938,000.
Are property prices in Dubai Production City (IMPZ) going up or down?
Up. Comparing the 12 months to 2 November 2026 with the 12 months before, like for like (the same buildings, bedrooms and ready or off-plan status), prices per sq ft in Dubai Production City (IMPZ) were up 3.5%, based on 1,757 sales in 51 buildings that sold in both periods. Ready homes: +4.6%; off-plan: +2.8%.
What is Dubai Production City (IMPZ) called in Dubai Land Department records?
Dubai Land Department records list Dubai Production City (IMPZ) under the master project International Media Production Zone, in the area Me'Aisem First.
What do ready and off-plan apartments cost in Dubai Production City (IMPZ)?
In the 12 months to 2 November 2026, ready apartments in Dubai Production City (IMPZ) sold for a median AED 992 per sq ft (791 sales) and off-plan apartments for AED 1,406 per sq ft (2,258 sales). They are mostly different buildings, so the gap is not a like-for-like comparison.
How much does a 1-bedroom apartment cost in Dubai Production City (IMPZ)?
The median price of a 1-bedroom apartment in Dubai Production City (IMPZ) was AED 1.07M (1,298 sales in the 12 months to 2 November 2026, AED 1,308 per sq ft). Other sizes: studio AED 653,330, 2-bedroom AED 1.56M and 3-bedroom AED 2.1M.
Where do these figures come from?
Source: Dubai Land Department open data, published on data.dubai and used under the Dubai Open Data Licence. The figures are Throne Properties’ own analysis and are indicative only. They are not endorsed by the Dubai Land Department or the Government of Dubai. Each figure is a median of recorded sales in the 12 months shown; our How we calculate page explains the method.
Other Dubai areas
All areas →Figures are medians of Dubai Land Department recorded residential sales over the 12 months to 2 November 2026 and are indicative only. Dubai Land Department publishes with a delay, so the most recent weeks may be incomplete. Villa, townhouse and plot prices per sqft use the registered unit or plot area, so they are not directly comparable with apartment prices. Individual properties vary with size, view, floor, condition and payment terms. This is not a valuation or financial advice.