Dubai property market reports
Quarterly sales, prices, off-plan share and top areas for the Dubai residential market, built from recorded transactions. Every report is generated from the Dubai Land Department data, so the numbers are what actually sold.
Data to 2 November 2026 · residential salesLatest full quarter: Q3 2026 Preliminary
Full report →Dubai recorded 34,051 residential sales worth AED 66.5bn in Q3 2026, down 36.4% on Q3 2025. Ready apartments sold at a median AED 1,387 per sqft, up 5.2% on Q3 2025.
The market over time
Sales per quarter
Residential sales transactions, full quarters.
Sales value per quarter
AED billion, full quarters.
Ready apartment price per sqft
Median AED per sqft, existing properties only.
Ready villa price per sqft
Median AED per sqft of unit or plot area.
Every quarter since Q1 2023 in one table
| Quarter | Sales | Total value, AED bn | Ready apartments, AED / sqft | Ready villas, AED / sqft | Off-plan share |
|---|---|---|---|---|---|
| Q4 2026 to 2 Nov | Sales10,678 | AED bn22.6 | Apt / sqft1,379 | Villa / sqft1,470 | Off-plan63.4% |
| Q3 2026 | Sales34,051 | AED bn66.5 | Apt / sqft1,387 | Villa / sqft1,432 | Off-plan70.9% |
| Q2 2026 | Sales34,454 | AED bn73.8 | Apt / sqft1,403 | Villa / sqft1,430 | Off-plan75.9% |
| Q1 2026 | Sales42,095 | AED bn106.3 | Apt / sqft1,433 | Villa / sqft1,495 | Off-plan70.4% |
| Q4 2025 | Sales52,890 | AED bn123.3 | Apt / sqft1,386 | Villa / sqft1,468 | Off-plan71.5% |
| Q3 2025 | Sales53,519 | AED bn122.7 | Apt / sqft1,319 | Villa / sqft1,386 | Off-plan72.5% |
| Q2 2025 | Sales44,789 | AED bn109.8 | Apt / sqft1,366 | Villa / sqft1,369 | Off-plan65.7% |
| Q1 2025 | Sales39,656 | AED bn92.5 | Apt / sqft1,348 | Villa / sqft1,354 | Off-plan62.3% |
| Q4 2024 | Sales46,345 | AED bn106.1 | Apt / sqft1,285 | Villa / sqft1,288 | Off-plan66.0% |
| Q3 2024 | Sales45,959 | AED bn105.5 | Apt / sqft1,191 | Villa / sqft1,227 | Off-plan66.8% |
| Q2 2024 | Sales39,171 | AED bn90.1 | Apt / sqft1,230 | Villa / sqft1,165 | Off-plan63.5% |
| Q1 2024 | Sales32,972 | AED bn79.4 | Apt / sqft1,238 | Villa / sqft1,118 | Off-plan58.4% |
| Q4 2023 | Sales30,002 | AED bn71.9 | Apt / sqft1,187 | Villa / sqft1,049 | Off-plan56.4% |
| Q3 2023 | Sales32,414 | AED bn83.3 | Apt / sqft1,105 | Villa / sqft1,004 | Off-plan58.6% |
| Q2 2023 | Sales26,405 | AED bn63.9 | Apt / sqft1,145 | Villa / sqft949 | Off-plan52.8% |
| Q1 2023 | Sales27,410 | AED bn63.6 | Apt / sqft1,129 | Villa / sqft877 | Off-plan56.1% |
On the market with Throne today
These are asking prices on our own listings, not recorded sale prices.
All reports
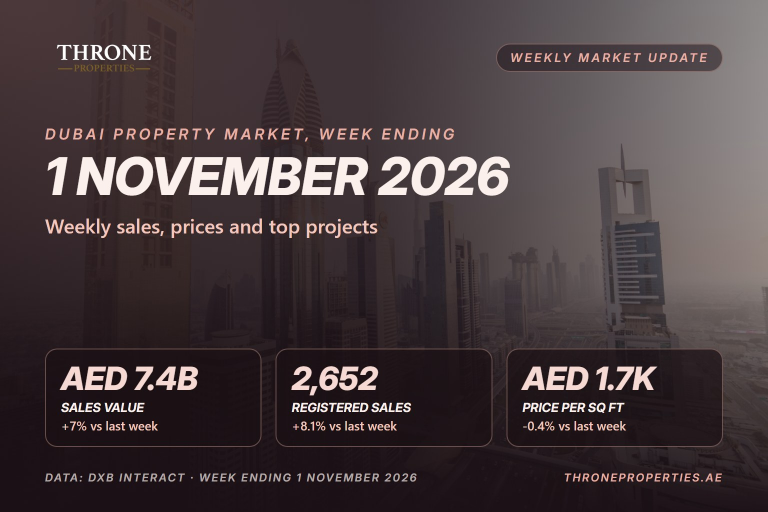
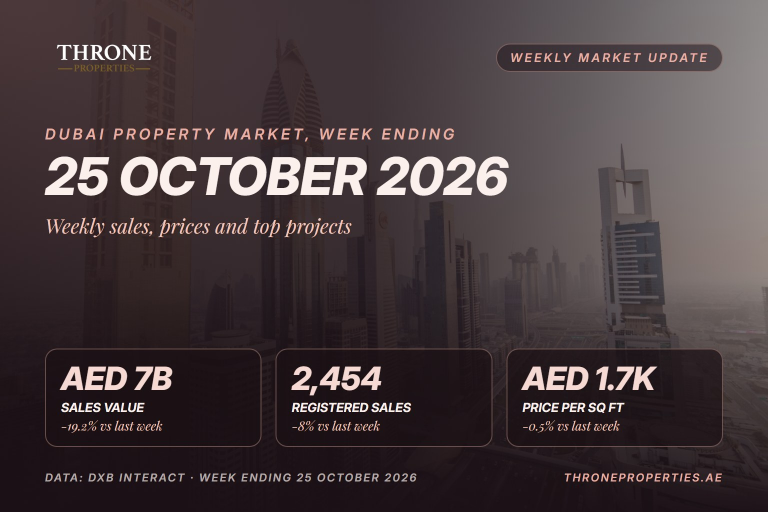
Weekly market updates
All articles →
Try our free Dubai property tools
Want the numbers for your own property?
We value properties against recorded sales in the same building, and can walk you through what the market data means for your plans.
Source: Dubai Land Department open transaction data, residential sales registered up to 2 November 2026 (apartments, hotel apartments, villas, townhouses and residential land), grouped by calendar quarter of the transaction date. Prices per sqft are medians; ready (existing) and off-plan sales are shown separately because they are priced differently, and sales under AED 250 per sqft are ignored. Total value excludes single transactions above AED 300 million. Villa, townhouse and plot prices per sqft use the registered unit or plot area. Area and project names follow Dubai Land Department records. Mortgage figures, where shown, cover all property types. A quarter that is not finished is shown with the number of days it covers, and its totals are not compared with full quarters. Quarters that ended less than 60 days before the data date are marked preliminary, because the Dubai Land Department adds some transactions after the fact. This is market information, not a valuation or financial advice.