Dubai Property Market Update: Most Active Areas, Yields and Price Growth (3 October 2026)

By Throne PropertiesPublished 5 October 20268 min read
Source: DXB Interact (dxbinteract.com), based on registered Dubai Land Department transactions. All figures belong to DXB Interact. Period: last 3 months to 3 October 2026.

This Dubai property market update shows where buyers and tenants have been most active over the last 3 months, by area, for apartments and villas, in the off-plan (primary) and ready (resale) markets. Use it to see where demand is concentrated, where rents are strongest and where prices are moving.

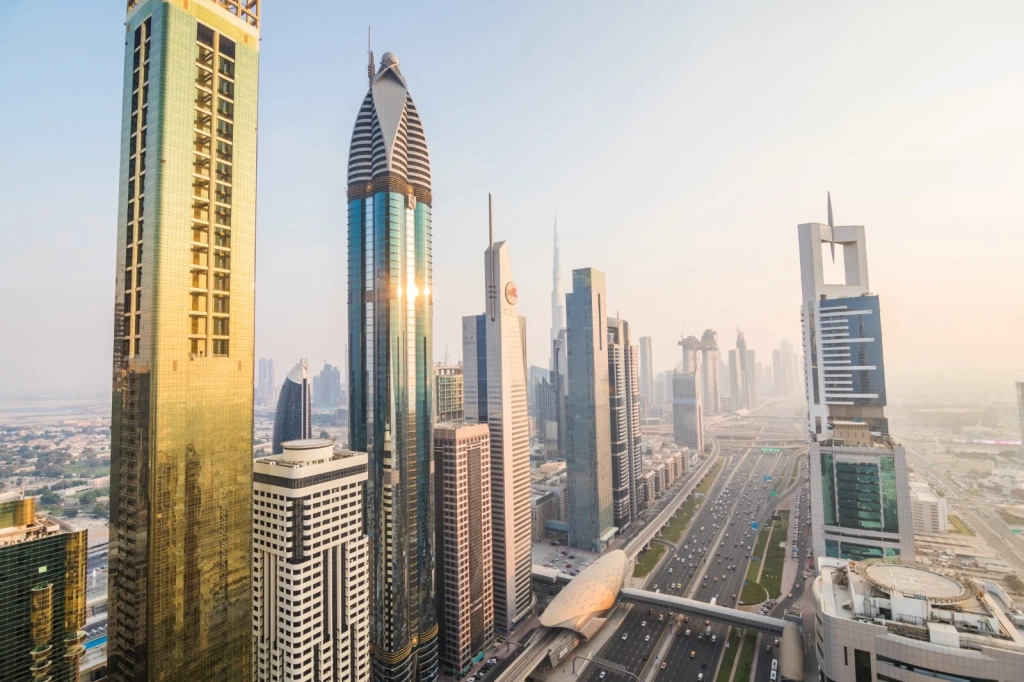
Dubai property market update: Dubai skyline with downtown towers
Busiest off-plan apartments
Dubai South
13,940 sales · +110% vs previous period
Busiest ready apartments
Al Barsha South Fourth
1,021 sales · +38% vs previous period
Top ready-villa yield
6.12%
Jumeirah Village Circle
Fastest price growth
53%
Al Thanyah First · ready apartments

Key takeaways from this Dubai property market update

  • Off-plan apartments: Dubai South led with 13,940 registered sales (109.8% vs the previous period), at a median of AED 928.5K.
  • Ready apartments: Al Barsha South Fourth was the busiest resale area with 1,021 sales (37.8%), followed by Business Bay.
  • Villas: Damac Lagoons topped ready-villa sales (212), while Al Yufrah 1 led off-plan villa sales (288).
  • Rentals: Al Barsha South Fourth had the most apartment rental contracts (31,328) at a median rent of AED 65K.
  • Villa yields: Jumeirah Village Circle showed the highest villa rental yield among ready homes at 6.12%.
  • Price growth: Al Thanyah First led ready-apartment price growth (53%), and Jumeirah Golf Estates led villas (12.7%).

In short, off-plan buyers concentrated on Dubai South, while resale demand was strongest in Al Barsha South Fourth. However, a large percentage change on a small number of sales can look dramatic, so compare areas with care. Meanwhile, Al Barsha South Fourth recorded the most apartment rental contracts. Overall, this Dubai property market update highlights where activity is highest, and the charts make the differences easier to see.

Dubai property market update: what changed since last week

The top 10 lists are unchanged from last week.

Dubai property market update: apartment sales

Off-plan apartments (primary market)

Off-plan apartments: most registered sales
Primary market, last 3 months. Arrows show the change vs the previous period; median price under each area.
Dubai SouthAED 928.5K
13,940 ▲ 110%
Al Barsha South FourthAED 1.1M
7,524 ▼ 41%
Wadi Al Safa 5AED 959.7K
6,916 ▼ 8%
Wadi Al Safa 3AED 727.6K
6,419 ▲ 124%
Jabal Ali FirstAED 1.6M
5,717 ▲ 18%
4,750 ▲ 42%
Wadi Al Safa 4AED 912.5K
3,883 ▲ 60%
Al Barsha South FifthAED 1.2M
3,728 ▲ 3%
Business BayAED 2.5M
3,312 ▼ 61%
Madinat Dubai AlmelaheyahAED 2.5M
3,227 ▼ 22%
Source: DXB Interact
View the full table
Area Median price Sales Change vs previous period
Dubai South AED 928.5K 13,940 109.8%
Al Barsha South Fourth AED 1.1M 7,524 -40.5%
Wadi Al Safa 5 AED 959.7K 6,916 -7.8%
Wadi Al Safa 3 AED 727.6K 6,419 124.3%
Jabal Ali First AED 1.6M 5,717 17.7%
Dubai Islands AED 2.9M 4,750 42.1%
Wadi Al Safa 4 AED 912.5K 3,883 60.1%
Al Barsha South Fifth AED 1.2M 3,728 2.6%
Business Bay AED 2.5M 3,312 -60.5%
Madinat Dubai Almelaheyah AED 2.5M 3,227 -21.8%

Ready apartments (resale market)

Ready apartments: most registered sales
Resale market, last 3 months. Arrows show the change vs the previous period; median price under each area.
Al Barsha South FourthAED 860K
1,021 ▲ 38%
Business BayAED 1.4M
715 ▲ 13%
Marsa DubaiAED 2.1M
651 ▲ 4%
Al MerkadhAED 1.3M
468 ▲ 17%
466 ▲ 34%
Hadaeq Sheikh Mohammed Bin RashidAED 2M
363 ▲ 38%
Jabal Ali FirstAED 790K
330 ▲ 25%
295 ▼ 5%
Al Barsha South ThirdAED 877.5K
286 ▼ 6%
Al Hebiah FourthAED 685K
275 ▲ 27%
Source: DXB Interact
View the full table
Area Median price Sales Change vs previous period
Al Barsha South Fourth AED 860K 1,021 37.8%
Business Bay AED 1.4M 715 12.8%
Marsa Dubai AED 2.1M 651 4.3%
Al Merkadh AED 1.3M 468 17.3%
Downtown Dubai AED 2.7M 466 33.5%
Hadaeq Sheikh Mohammed Bin Rashid AED 2M 363 37.5%
Jabal Ali First AED 790K 330 24.5%
Dubai Creek Harbour AED 2.4M 295 -4.8%
Al Barsha South Third AED 877.5K 286 -5.6%
Al Hebiah Fourth AED 685K 275 27.3%

Dubai property market update: villa sales

Off-plan villas (primary market)

Off-plan villas: most registered sales
Primary market, last 3 months. Median price under each area.
Al Yufrah 1AED 5.7M
288 ▲ 1,957%
Dubai SouthAED 5.1M
122 ▲ 56%
Damac Islands 2AED 3.2M
101 ▲ 53%
90 ▼ 27%
Dubai International Academic CityAED 4.3M
88
49 ▼ 50%
41 ▼ 23%
Saih Shuaib 1AED 6.9M
40 ▼ 89%
Al Yelayiss 5AED 8M
33 ▼ 78%
Dubai Investment Park FirstAED 1.3M
27
Source: DXB Interact
View the full table
Area Median price Sales Change vs previous period
Al Yufrah 1 AED 5.7M 288 1957.1%
Dubai South AED 5.1M 122 56.4%
Damac Islands 2 AED 3.2M 101 53%
Damac Hills 2 AED 1.7M 90 -27.4%
Dubai International Academic City AED 4.3M 88 0%
Damac Islands AED 3.6M 49 -50%
Jumeirah Golf Estates AED 17.9M 41 -22.6%
Saih Shuaib 1 AED 6.9M 40 -88.9%
Al Yelayiss 5 AED 8M 33 -78.3%
Dubai Investment Park First AED 1.3M 27 0%

Ready villas (resale market)

Ready villas: most registered sales
Resale market, last 3 months. Median price under each area.
212 ▲ 25%
109 ▲ 23%
Tilal Al GhafAED 11.5M
65 ▲ 20%
Damac HillsAED 4.6M
58 ▲ 16%
Jabal Ali VillageAED 5M
56 ▲ 460%
53 ▲ 43%
38 ▲ 19%
Al FurjanAED 5.9M
36 ▲ 39%
Al Yufrah 1AED 5.1M
31
Arabian Ranches 1AED 10.6M
29 ▲ 71%
Source: DXB Interact
View the full table
Area Median price Sales Change vs previous period
Damac Lagoons AED 2.8M 212 24.7%
Damac Hills 2 AED 1.9M 109 22.5%
Tilal Al Ghaf AED 11.5M 65 20.4%
Damac Hills AED 4.6M 58 16%
Jabal Ali Village AED 5M 56 460%
Damac Islands AED 2.6M 53 43.2%
Dubai Hills Estate AED 11.6M 38 18.8%
Al Furjan AED 5.9M 36 38.5%
Al Yufrah 1 AED 5.1M 31 0%
Arabian Ranches 1 AED 10.6M 29 70.6%

Rental market: the busiest areas

Ready apartments for rent

Ready apartments: most rental contracts
Median yearly rent under each area name.
Al Barsha South FourthAED 65K
31,328
Al Warsan FirstAED 37K
28,749
Jabal Ali FirstAED 57.8K
28,226
Marsa DubaiAED 120K
20,838
18,610
Nadd HessaAED 54K
17,727
Al Nahda SecondAED 52K
17,166
Al Barsha FirstAED 75K
15,292
Al Barsha South ThirdAED 60K
14,717
Al KaramaAED 65K
13,799
Source: DXB Interact
View the full table
Area Rental contracts Median rent (yearly) Indicative yield
Al Barsha South Fourth 31,328 AED 65K 6.5%
Al Warsan First 28,749 AED 37K 7.63%
Jabal Ali First 28,226 AED 57.8K 4.02%
Marsa Dubai 20,838 AED 120K 4.7%
Business Bay 18,610 AED 93K 4.65%
Nadd Hessa 17,727 AED 54K 5.57%
Al Nahda Second 17,166 AED 52K n/a
Al Barsha First 15,292 AED 75K 2.93%
Al Barsha South Third 14,717 AED 60K 6.67%
Al Karama 13,799 AED 65K n/a

Ready villas for rent

Ready villas: most rental contracts
Median yearly rent under each area name.
Damac Hills 2AED 94.5K
1,577
MirdifAED 120K
1,307
Damac HillsAED 200K
414
321
321
Al FurjanAED 230K
281
Al Barsha FirstAED 231.1K
260
MudonAED 185K
255
Jumeirah FirstAED 250K
253
Nad Al Sheba ThirdAED 226.9K
248
Source: DXB Interact
View the full table
Area Rental contracts Median rent (yearly) Indicative yield
Damac Hills 2 1,577 AED 94.5K 5.43%
Mirdif 1,307 AED 120K n/a
Damac Hills 414 AED 200K 4.37%
Jumeirah Park 321 AED 320K 3.99%
Damac Lagoons 321 AED 145K 5.27%
Al Furjan 281 AED 230K 4.11%
Al Barsha First 260 AED 231.1K n/a
Mudon 255 AED 185K 5.29%
Jumeirah First 253 AED 250K n/a
Nad Al Sheba Third 248 AED 226.9K n/a

Highest rental yields

Ready apartments: highest rental yields
Median rent compared with median price.
Al Hebiah SecondAED 60K
8.84%
8.19%
7.91%
Al Warsan FirstAED 37K
7.63%
Saih Shuaib 2AED 50K
7.61%
Al Thanyah FirstAED 78.1K
7.02%
Source: DXB Interact
View the full table
Area Yield Median rent (yearly)
Al Hebiah Second 8.84% AED 60K
Wadi Al Safa 3 8.19% AED 62K
Wadi Al Safa 7 7.91% AED 60K
Al Warsan First 7.63% AED 37K
Saih Shuaib 2 7.61% AED 50K
Al Thanyah First 7.02% AED 78.1K
Ready villas: highest rental yields
Median rent compared with median price.
6.12%
International City Phase 1AED 115K
5.75%
Damac Hills 2AED 94.5K
5.43%
MudonAED 185K
5.29%
5.27%
Arabian Ranches 2AED 300K
4.84%
Jabal Ali VillageAED 225K
4.5%
4.39%
Damac HillsAED 200K
4.37%
Al FurjanAED 230K
4.11%
Source: DXB Interact
View the full table
Area Yield Median rent (yearly)
Jumeirah Village Circle 6.12% AED 160K
International City Phase 1 5.75% AED 115K
Damac Hills 2 5.43% AED 94.5K
Mudon 5.29% AED 185K
Damac Lagoons 5.27% AED 145K
Arabian Ranches 2 4.84% AED 300K
Jabal Ali Village 4.5% AED 225K
Arabian Ranches 3 4.39% AED 325K
Damac Hills 4.37% AED 200K
Al Furjan 4.11% AED 230K

Industrial districts and figures above 12% are left out, because a handful of contracts can distort them.

Where prices are rising fastest

Ready apartments: fastest price growth
Median price per sq ft under each area name.
Al Thanyah FirstAED 1,921
53%
Wadi Al Safa 4AED 1,720
37.6%
Warsan FourthAED 968
32.5%
Dubai Investment Park SecondAED 745
27.9%
26.2%
Jumeirah Bay IslandsAED 10,982
22.4%
Dubai Investment Park FirstAED 1,080
16.3%
Al Barsha South FifthAED 1,419
16.2%
Dubai SouthAED 1,211
15.9%
Nadd HessaAED 979
15.8%
Source: DXB Interact
View the full table
Area Price growth Median price per sq ft
Al Thanyah First 53% AED 1,921
Wadi Al Safa 4 37.6% AED 1,720
Warsan Fourth 32.5% AED 968
Dubai Investment Park Second 27.9% AED 745
Wadi Al Safa 3 26.2% AED 1,301
Jumeirah Bay Islands 22.4% AED 10,982
Dubai Investment Park First 16.3% AED 1,080
Al Barsha South Fifth 16.2% AED 1,419
Dubai South 15.9% AED 1,211
Nadd Hessa 15.8% AED 979
Ready villas: fastest price growth
Median price per sq ft under each area name.
12.7%
Jabal Ali VillageAED 1,698
8.6%
Nad Al Sheba GardensAED 2,091
5.7%
Damac IslandsAED 1,104
4.3%
The OasisAED 1,777
4.1%
3.6%
Al FurjanAED 1,818
2.8%
Dubai IslandsAED 1,633
2.4%
Arabian Ranches 2AED 1,899
1.9%
1.8%
Source: DXB Interact
View the full table
Area Price growth Median price per sq ft
Jumeirah Golf Estates 12.7% AED 2,281
Jabal Ali Village 8.6% AED 1,698
Nad Al Sheba Gardens 5.7% AED 2,091
Damac Islands 4.3% AED 1,104
The Oasis 4.1% AED 1,777
Dubai Hills Estate 3.6% AED 2,742
Al Furjan 2.8% AED 1,818
Dubai Islands 2.4% AED 1,633
Arabian Ranches 2 1.9% AED 1,899
Arabian Ranches 3 1.8% AED 1,593

How to read this Dubai property market update

Use this Dubai property market update as a guide to relative activity between areas, not as a valuation of any single property.

  • Off-plan (primary) means first sales from a developer; ready (resale) means existing homes sold on.
  • Change vs previous period compares with the previous equal-length period, so a large percentage on a small number of sales can look dramatic.
  • Indicative yield is DXB Interact’s figure: median rent compared with median price. Use it to compare areas, not as a promise of returns.
  • Area names follow the Dubai Land Department’s official area names, which can differ from the names of communities you know.

Explore with Throne Properties

Each week we refresh this Dubai property market update with the latest registered transactions. Looking at one of these areas after reading this Dubai property market update? Browse homes for sale, homes for rent and off-plan projects, or talk to an advisor about a shortlist.

Source: DXB Interact (dxbinteract.com), based on registered Dubai Land Department transactions. All figures belong to DXB Interact. Period: last 3 months to 3 October 2026.

This Dubai property market update is informational only, not investment advice.
Free tools

Try our free Dubai property tools

See all tools →

Talk to a Dubai property specialist

Licensed brokerage since 1988. Tell us what you are looking for, or get a free valuation based on recorded sales.

Compare listings

Compare