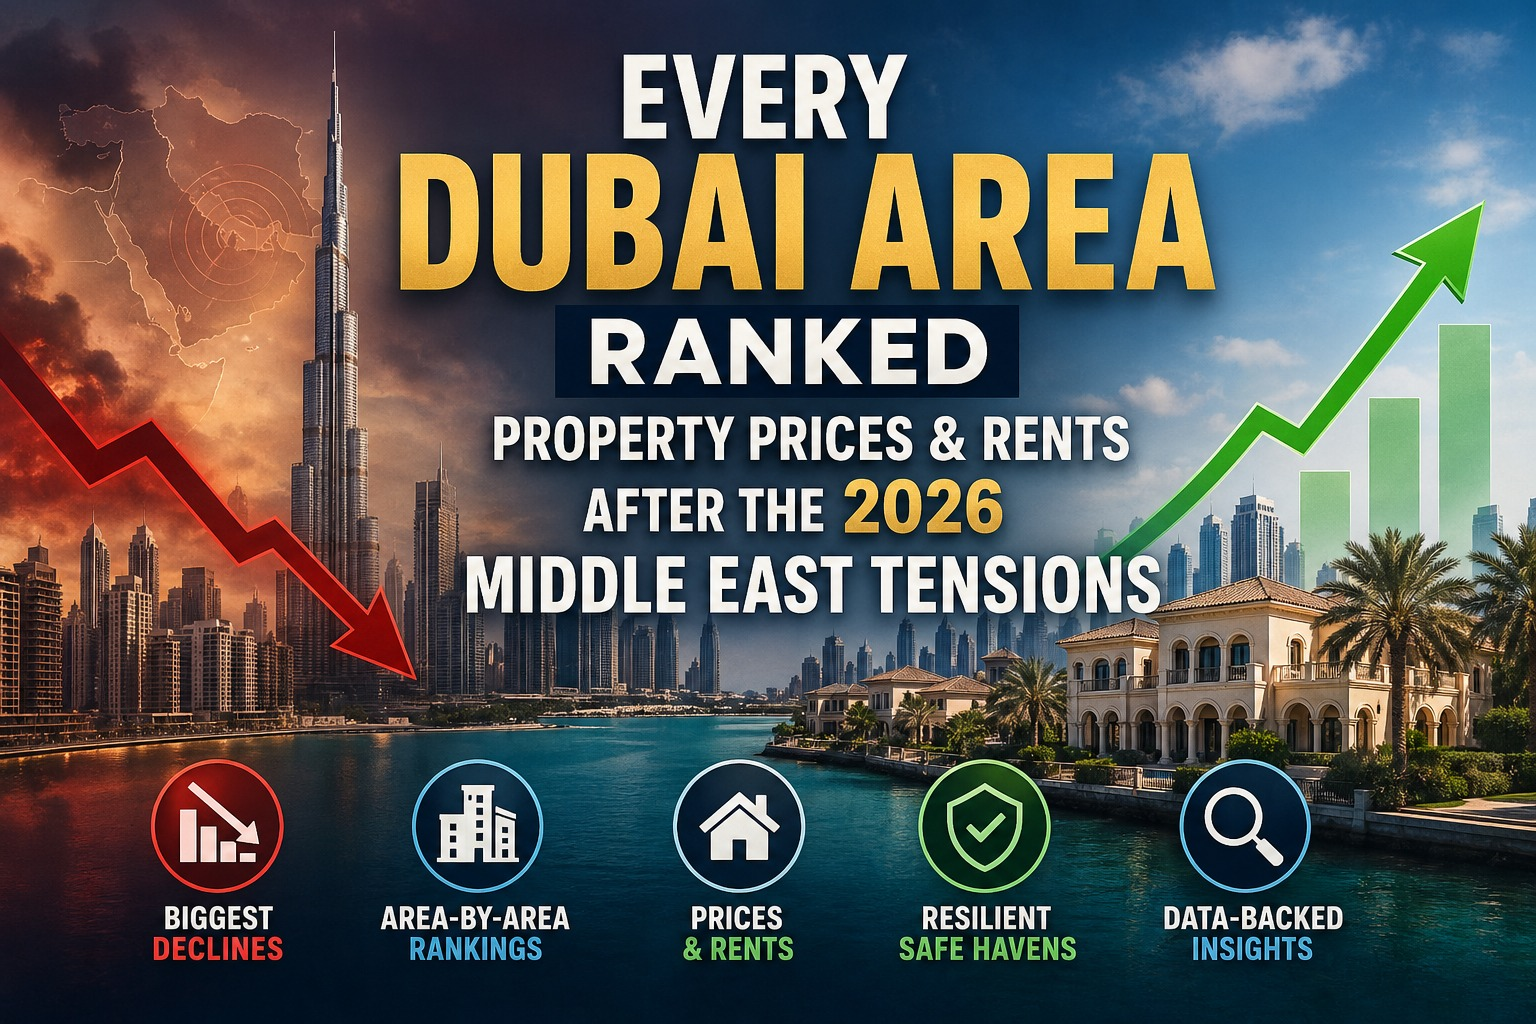
The early-2026 Iran-Israel conflict and subsequent US-led strikes sent a brief but sharp shockwave through the UAE’s real estate sector. However, the impact was far from uniform. For investors and tenants tracking Dubai property prices after Iran-Israel conflict 2026, the data reveals a deeply split market. Specifically, some communities recorded double-digit declines, while others barely registered a tremor — and a handful even saw demand surge. To understand this divergence, let’s examine the key numbers.
In this analysis, we rank every major Dubai area by how much prices and rents moved, using verified reports from ValuStrat, Property Finder and leading analysts. If you’re navigating the post-conflict landscape, this is your definitive reference.
How the 2026 Iran-Israel Conflict Reshaped Dubai Property Prices
Before we dive into the area rankings, it’s important to understand the macro picture that underpins Dubai property prices after Iran-Israel conflict 2026:
- The ValuStrat Price Index recorded its first monthly decline since 2020 (down 5.9% in March 2026).
- Transaction volumes fell 14% YoY in early April, and 38% in the immediate two weeks after the escalation.
- Off-plan sales—which accounted for nearly two-thirds of 2025 transactions—were hit hardest, while ready homes proved significantly more resilient.
- Citi analysts forecasted an average annual price decline of 7% through 2028 in a bear-case scenario linked to sustained regional instability.
Key insight: The market corrected, but the correction was concentrated in speculative, off-plan and ultra-luxury segments. Ready, mid-tier homes held firm. For more on how off-plan risk compares to ready properties, read our guide on Dubai off-plan vs ready property investing.
Property Prices: Biggest to Lowest Declines
(Ranked from most negatively impacted to most stable/positive)
*All figures are based on the latest available data from late April 2026, reflecting the immediate impact on Dubai property prices after Iran-Israel conflict 2026.*
| Area | Property Type | Price Impact | What’s Happening |
|---|---|---|---|
| Arabian Ranches Phase 2 | Villas | ↓ 11.5% | Steepest monthly villa drop; high new supply amplified the correction |
| Dubai Hills Estate | Villas | ↓ 10.8% | Premium villas softened quickly as short-term investor sentiment shifted |
| Jumeirah Village Circle (JVC) | Apartments | ↓ 10.3% | Heavy off-plan pipeline and speculative buying pressured prices downward |
| Burj Khalifa / Downtown Dubai | Apartments | ↓ 10.2% | Iconic luxury units saw discounts of 12–15% in motivated sales; some high-end sellers offered 15-30% off |
| Jumeirah Beach Residence (JBR) | Apartments | ↓ 9.9% | Waterfront tourist zone was sensitive to short-term rental uncertainty |
| Dubai Creek Harbour | Off-plan / Apartments | ~ ↓ 9% | Developers offered ~10% discounts and flexible payment plans to attract investors |
| Palm Jumeirah | Villas | ↓ 8.4% | Negative sentiment after one building was damaged; luxury sellers offered discounts, though ready villas later saw a demand rebound |
| Business Bay | Apartments | ↓ 5–8% | High upcoming supply (12,000+ units in 2026) weighed heavily on the off-plan and mid-range segments |
| Dubai South | Apartments / Villas | ↓ 5–6% | Speculative investment zone with large upcoming supply pipeline amplified caution |
| Arjan | Apartments | ↓ 5–6% | Similar to JVC; high off-plan volume and rental supply softened values |
| Jumeirah Lake Towers (JLT) | Apartments | ↓ 3–5% | Pressure from new supply and reduced short-term rental demand |
| District One (MBR City) | Villas | ↓ 1.9% | Premium low-density community; demand from wealthy families remained sturdy |
| Emirates Hills | Villas | ↓ 1.7% | Ultra-luxury villas relatively insulated; only a modest monthly slip |
| Al Kifaf | Apartments | ↓ 1.2% | Limited new supply and high inherent demand kept prices stable |
| Meydan One | Apartments | ↓ 1.1% | Lower price point attracted value-seeking investors after the conflict |
| Citywide Average (all residential) | ↓ 5.9% | First monthly drop since 2020; correction broad but not a crash | |
| Mid-tier ready homes (Arabian Ranches, Al Furjan, etc.) | Villas/Townhouses | 0 to -6% | End-user demand from Dubai’s large expatriate workforce kept this segment mostly stable |
Rental Prices: Biggest Drops to Most Stable Areas
(Ranked from most negatively impacted to most stable)
*The rental market was already cooling before the conflict due to massive new supply. The geopolitical shock accelerated the trend, making Dubai property prices after Iran-Israel conflict 2026 directly relevant to rent negotiations as well.*
| Area | Property Type | Rent Impact | What’s Happening |
|---|---|---|---|
| Downtown Dubai | Luxury Apartments | ~ ↓ 15% | Short-term rental (Airbnb) demand dropped sharply; many units shifted to long-term lets |
| Palm Jumeirah | Luxury Apartments | ~ ↓ 15% | Reduced tourism and short-term let demand forced landlords to cut rents significantly |
| Jumeirah Lake Towers (JLT) | Apartments | ~ ↓ 15% | High-density area reliant on young professionals and short-term tenants saw sharp softening |
| Luxury segment (general) | Apartments | ↓ 5–10% | High-end new leases discounted; short-term rental yields compressed |
| Dubailand | Villas | ↓ 5–7% | New villa handovers and reduced expat mobility eased rental rates |
| Al Barsha | Villas / Apartments | ↓ 5–7% | Higher supply across segments gave tenants more negotiating power |
| Citywide Average Rental | All residential | ↓ 6.7% | Market rebalancing after rapid growth; consolidation, not collapse |
| Jumeirah 1 | Villas / Apartments | Modest decline | Rents easing gently, making the area more affordable without a sharp drop |
| JVC, Silicon Oasis, Discovery Gardens, Sports City | Apartments | Stable / slight easing | New supply softened rents slightly; end-user demand held base steady |
| International City, Deira, Al Nahda | Apartments | Stable (0 to -2%) | Core workforce demand kept these areas virtually untouched by geopolitical sentiment |
| The Springs, The Meadows, Dubai Hills Estate | Villas | Stable | Family-oriented communities with long tenancies and strong schools; rental stability remained intact |
for more renting info you can check our blog: Navigating Dubai Tenancy Renewals in 2025: Rules, Process & Avoiding Disputes
What This Tells Us: 5 Takeaways from Dubai Property Prices After Iran-Israel Conflict 2026
What This Tells Us: 5 Takeaways from Dubai Property Prices After Iran-Israel Conflict 2026
1. First and foremost, the market has experienced a correction — not a crash.
At first glance, the 5.9% citywide monthly decline and 6.7% rent drop sound alarming. But in reality, they only erase about six months of rapid growth. Consequently, values are roughly back to mid-2025 levels — not pre-boom territory.
2. Additionally, speculative and off-plan segments took the biggest hit.
If you’re examining Dubai property prices after Iran-Israel conflict 2026, the lesson is clear: off-plan projects and luxury apartments in high-supply zones saw double-digit discounts. Meanwhile, ready mid-market homes barely moved, demonstrating the strength of end-user demand.
3. On the other hand, established safe havens worked as intended.
Prime ready districts like Downtown Dubai, Business Bay, and villa communities such as The Springs and District One proved highly resilient. In fact, Palm Jumeirah ready villas even saw a 38% year-on-year demand surge as regional wealth sought shelter.
4. As a result of this shift, renters gained power — but only in certain pockets.
If you’re negotiating a new lease in a luxury tower or a suburban villa community, you can expect discounts of 5–15%. In contrast, in affordable, workforce-driven areas, rents are stable and landlords remain firm.
5. Finally, cash is still king.
Mortgage-dependent buyers face more caution, whereas those with liquidity can access motivated sellers in the luxury segment — often at 10–20% below recent peaks. For a step-by-step guide, see our cash buyer advantages in 2026 Dubai article.
Data Sources We Trusted
- ValuStrat Price Index (VPI) — Gulf Business, April 27, 2026
- Community-level breakdown — The National, April 24, 2026
- Off-plan and rental shifts — What’s On, InvestGO, Property Finder (April 2026)
- Investor sentiment & luxury discounts — Times Now News, Sherwoods Property
All figures reflect market data available in late April 2026. Always check the latest transaction data for your specific unit type and building.
The percentages mentioned above are the averages, if you are looking for the best deals in the market Contact Us on +971 58 253 1511